
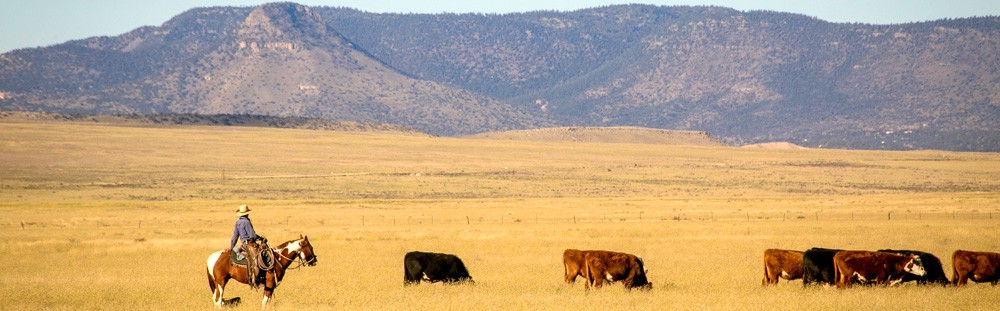
 Photo by Lyndsey Garber
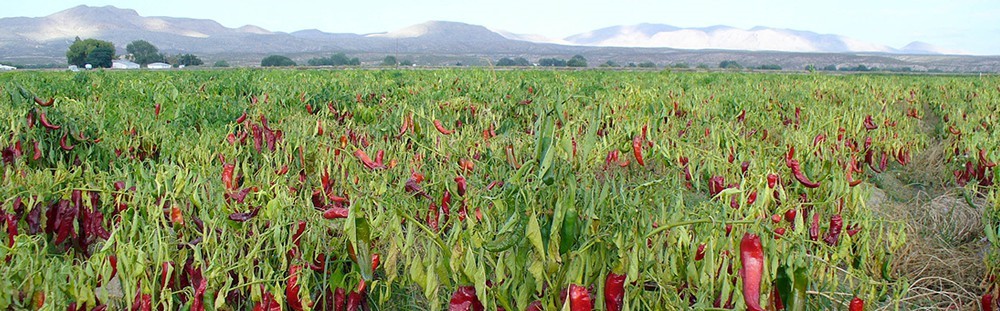 Photo by NM Department of Agriculture
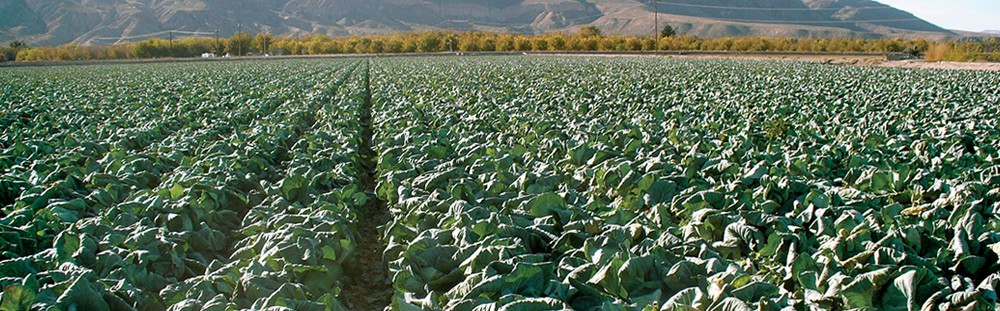 Photo by NM Department of Agriculture
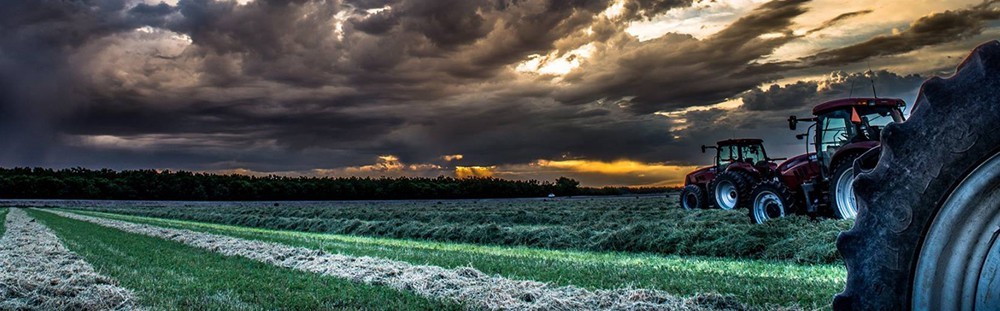 Photo by Jay Hill
 Photo by NM Department of Agriculture
 Photo by Lyndsey Garber
Agricultural Literacy Curriculum Matrix
Companion Resource
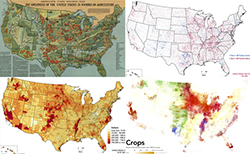
40 Maps that Explain Food in America
A collection of maps and graphs that represent farms, food production, and many other statistics in the United States. These maps provide excellent illustrations for students to understand how climate and geography affects the production of food as well as to provide statistics about the economics of food production through the years and across the United States.
URL
Author
Ezra Klein and Susannah Locke
Lessons Associated with this Resource
- By Land, Air, or Sea
- Agricultural Production Regions in the United States
- Geography and Climate for Agricultural Landscapes (Grades 6-8)
- Where Does it Grow? The Science of Climate and Food
- Geography and Climate for Agricultural Landscapes (Grades 9-12)
- Food Systems Feed the World
- Where Does It Come From?
- Growing Our State History (Grades 3-5)